小屏常见问题
# 小屏常见问题
# 1.在页面和卡片(组件)之间切换频繁麻烦
解决方案:
- 配置webpack配置新的命令serve:card
- 配置新的main入口,main-card.js
- 配置vue.config.js
package.json中:
"scripts": {
    "serve": "vue-cli-service serve",
    "serve:card": "cross-env mode=serve-card vue-cli-service serve",
    "lint": "vue-cli-service lint",
    "lint-fix": "vue-cli-service lint --fix",
    "build:app": "cross-env mode=build vue-cli-service build && node after-build-app.js"
  }
1
2
3
4
5
6
7
2
3
4
5
6
7
main-card.js中
注意:main-card.js跟main.js同级
import Vue from 'vue'
import App from './card-collection/ccp_gen-611302'
new Vue({
  render: h =>
    h(App, {
      props: {}
    })
}).$mount('#app')
1
2
3
4
5
6
7
8
2
3
4
5
6
7
8
在vue.config.js中:
if (process.env.mode === 'build' || process.env.NODE_ENV === 'development') {
  config.chainWebpack = config => {
    if (process.env.mode === 'serve-card') {
      config.entry('app').clear().add(path.resolve(__dirname, 'src/main-card.js')).end()
    }
    config.plugin('html').tap(args => {
      args[0].template = path.resolve(__dirname, 'public', process.env.NODE_ENV === 'development' ? 'index-local.html' : 'index.html')
      return args
    })
  }
}
1
2
3
4
5
6
7
8
9
10
11
2
3
4
5
6
7
8
9
10
11
# 2.echarts圆环图例太长,显示不清楚
解决方案:在legend下的 formatter,超过8个,让其换行显示
formatter: name => {
 if (name.length <= 8) {
  name = name.slice(0, 8)
 } else if (name.length > 8 && name.length < 16) {
  name = name.slice(0, 8) + '\n' + name.slice(8, name.length)
 } else {
  name = name.slice(0, 8) + '\n' + name.slice(8, 16) + '\n' + name.slice(16, name.length)
 }
  return [`{a|${name}}`, '\n', `{b| ${p + '%'} ${value}}`].join('   ') // 返回出图例所显示的内容是名称+百分比+数值
}
1
2
3
4
5
6
7
8
9
10
2
3
4
5
6
7
8
9
10
# 3.echarts图标的横行超出滚动条
解决方案:添加dataZoom属性
// 横向滚动
dataZoom: [
  {
    // 添加X轴滚动条
    realtime: true,
    show: true,
    start: 0,
    end: 60,
    height: 16
  },
  {
    type: 'inside',
    realtime: true,
    start: 0,
    end: 60
  }
  ]
1
2
3
4
5
6
7
8
9
10
11
12
13
14
15
16
17
2
3
4
5
6
7
8
9
10
11
12
13
14
15
16
17
// 左右滑动进度条
dataZoom: [
    {
        id: 'dataZoomX',
        type: 'slider',
        xAxisIndex: [0],
        filterMode: 'filter', // 设定为 'filter' 从而 X 的窗口变化会影响 Y 的范围。
        height: 20,
        bottom: 0
    }
    // start: 30,
    // end: 70
]
1
2
3
4
5
6
7
8
9
10
11
12
13
2
3
4
5
6
7
8
9
10
11
12
13
# 4.echarts的折线图,配置自定义放上去显示的文本内容和样式
解决方案:配置tooltip的formatter函数 注意:换行不能使用'\n',只能使用'br'
d.tooltip = {
  trigger: 'axis',
  axisPointer: {
    type: 'shadow'
  },
  formatter: function (params) {
    // return [`${params[0].name}`, `${params[0].value}`].join('\n')
    return params[0].name + '</br>' + "<span style='display:inline-block;margin-right:5px;border-radius:10px;width:10px;height:10px;background-color:#4ad2ff;'></span>" + '里程' + ': ' + params[0].value
  }
  // 额外自定义样式
  // extraCssText: 'width: 60px; white-space: pre-wrap;'
}
1
2
3
4
5
6
7
8
9
10
11
12
2
3
4
5
6
7
8
9
10
11
12
# 5.代码出现格式化,webstorm又无法修复问题
解决方案:
- 在package.json中配置scripts
- "lint-fix": "eslint --fix --ext .js,.vue src"
- 执行npm run lint-fix
# 6.修改vant的tab左右切换的样式,背景,边框,字体颜色
/deep/.active {
  color: #42d8ae !important;
  border-color: #42d8ae !important;
  background: #ecfbf6 !important;
}
1
2
3
4
5
2
3
4
5
# 7.通过值修改颜色
// 校验颜色
// 0-50,优,#00E400,,绿色
// 51~100,良,#FFFF00,黄色
// 101~150,轻度污染,#FF7E00,橙色
// 151~200,中度污染,#FF0000,红色
// 201~300,重度污染,#99004C,褐色
// 300以上,严重污染,#7E0023,深褐色
if (data[1].rows[0].value > 0 && data[1].rows[0].value <= 50) {
  data[1].rows[0].name = '优'
  data[1].rows[0].textColor = '#00E400'
} else if (data[1].rows[0].value > 50 && data[1].rows[0].value <= 100) {
  data[1].rows[0].name = '良'
  data[1].rows[0].textColor = '#FFFF00'
} else if (data[1].rows[0].value > 100 && data[1].rows[0].value <= 150) {
  data[1].rows[0].name = '轻度污染'
  data[1].rows[0].textColor = '#FF7E00'
} else if (data[1].rows[0].value > 150 && data[1].rows[0].value <= 200) {
  data[1].rows[0].name = '中度污染'
  data[1].rows[0].textColor = '#FF0000'
} else if (data[1].rows[0].value > 200 && data[1].rows[0].value <= 300) {
  data[1].rows[0].name = '重度污染'
  data[1].rows[0].textColor = '#99004C'
} else {
  data[1].rows[0].name = '严重污染'
  data[1].rows[0].textColor = '#7E0023'
}
1
2
3
4
5
6
7
8
9
10
11
12
13
14
15
16
17
18
19
20
21
22
23
24
25
26
2
3
4
5
6
7
8
9
10
11
12
13
14
15
16
17
18
19
20
21
22
23
24
25
26
# 8.内外圆环中,圆环中间带个数加单位,且换行显示百分比的,图例带百分比数字
- 小屏内的文本内容为:series[0].label.formatter,formatter: '{c}起\n{b}'
- c为value值,b为label图例的标签名称
- 内文本样式由series[0].emphasis.label.color设置
- 深层次的值和单位的样式,由series[0].emphasis.label.textStyle.rich.a.color设置

小屏右侧图例的文本,单位及颜色为:legend.formatter
默认显示突起第一个
// 默认突出选中,第一项
this.chart.dispatchAction({ type: 'highlight', seriesIndex: 0, dataIndex: 0 })
1
2
2
- 点击第一项凸起,其他项隐藏
// 移入点击某一项,显示某一项,其他项隐藏
  this.chart.on('mouseover', (v) => {
    if (v.dataIndex !== 0) {
      this.chart.dispatchAction({
        type: 'downplay',
        seriesIndex: 0,
        dataIndex: 0
      })
    }
  })
1
2
3
4
5
6
7
8
9
10
2
3
4
5
6
7
8
9
10
- 移出圆环,显示第一项
// 移除圆环,显示第一项
this.chart.on('mouseout', (v) => {
  this.chart.dispatchAction({ type: 'highlight', seriesIndex: 0, dataIndex: 0 })
})
1
2
3
4
2
3
4
formatter: function (name) {
    const cur = data.find(item => item.name === name)
    if (cur) {
      const rate = ((cur.value / total) * 100).toFixed(2)
      return `${name}       ${rate}%`
    }
    return name
  }
1
2
3
4
5
6
7
8
2
3
4
5
6
7
8

const list = data.length > 0 ? res.map((item, index) => {
          return {
            x: item.szjb,
            type: '',
            value: item.sl,
            unit: '个',
            sort: index + 1,
            rate: item.zb
          }
        }) : mock[0].rows
d.color = ['#42D8AE', '#4EB4FF', '#FFDC35', '#FF9D4D', '#FE7B5D']
d.legend = {
    right: 0,
    formatter: (x) => {
        const obj = list.filter(it => it.x === x)[0]
        const arr = [
            '{a|' + obj.x + '}'
        ]
        if (obj.sort === 1) {
            arr[1] = '{b|' + '  ' + obj.rate + '%' + '  ' + obj.value + '}'
        } else if (obj.sort === 2) {
            arr[1] = '{c|' + '  ' + obj.rate + '%' + '  ' + obj.value + '}'
        } else if (obj.sort === 3) {
            arr[1] = '{d|' + '  ' + obj.rate + '%' + '  ' + obj.value + '}'
        } else if (obj.sort === 4) {
            arr[1] = '{e|' + '  ' + obj.rate + '%' + '  ' + obj.value + '}'
        } else {
            arr[1] = '{f|' + '  ' + obj.rate + '%' + '  ' + obj.value + '}'
        }
        return arr.join('')
    },
    textStyle: {
        rich: {
            a: {
                color: '#5C626B',
                fontSize: 12
            },
            b: {
                color: '#42D8AE',
                fontSize: 12,
                fontWeight: 600
            },
            c: {
                color: '#4EB4FF',
                fontSize: 12,
                fontWeight: 600
            },
            d: {
                color: '#FFDC35',
                fontSize: 12,
                fontWeight: 600
            },
            e: {
                color: '#FF9D4D',
                fontSize: 12,
                fontWeight: 600
            },
            f: {
                color: '#FE7B5D',
                fontSize: 12,
                fontWeight: 600
            }
        }
    }
}
d.series[0].center = ['25%', '50%']
d.series[0].radius = ['40%', '60%']
d.series[0].emphasis = {
    label: {
        show: true,
        fontSize: 12,
        fontWeight: 'bold',
        formatter: function (t) {
            // console.log(t, 'tttt')
            const n = t.value + '个'
            const p = t.percent + '%'
            return '{num|' + n + '}' + '\n' + '{per|' + p + '}'
        },
        textStyle: {
            rich: {
                num: {
                    fontSize: 16,
                    color: '#42D8AE',
                    lineHeight: 30
                },
                per: {
                    fontSize: 10,
                    color: '#5C626B',
                    lineHeight: 12
                }
            }
        }
    }
}
1
2
3
4
5
6
7
8
9
10
11
12
13
14
15
16
17
18
19
20
21
22
23
24
25
26
27
28
29
30
31
32
33
34
35
36
37
38
39
40
41
42
43
44
45
46
47
48
49
50
51
52
53
54
55
56
57
58
59
60
61
62
63
64
65
66
67
68
69
70
71
72
73
74
75
76
77
78
79
80
81
82
83
84
85
86
87
88
89
90
91
92
93
94
2
3
4
5
6
7
8
9
10
11
12
13
14
15
16
17
18
19
20
21
22
23
24
25
26
27
28
29
30
31
32
33
34
35
36
37
38
39
40
41
42
43
44
45
46
47
48
49
50
51
52
53
54
55
56
57
58
59
60
61
62
63
64
65
66
67
68
69
70
71
72
73
74
75
76
77
78
79
80
81
82
83
84
85
86
87
88
89
90
91
92
93
94
- 实现效果

# 9.内外圆环,内圆环内为总数和单位,外圆环为名称
<pie-total
    v-if="optionsMap['1632407175862']"
    class="mtb15"
    :options="optionsMap['1632407175862']"
    :center-unit="centerUnits"
    :config="components[0].data.config"
    theme="zhongshan"
/>
import PieTotal from '../../components/pie-total2/index.vue'
// 圆环中间下面的单位
centerUnits: '个'
const list = res.map((item) => ({
    x: item.lx,
    type: '',
    value: item.sl,
    unit: '个'
}))
const d = transform.getOption(list, item.data.rowsConfig)
1
2
3
4
5
6
7
8
9
10
11
12
13
14
15
16
17
18
2
3
4
5
6
7
8
9
10
11
12
13
14
15
16
17
18
/deep/.active {
  color: #42d8ae !important;
  border-color: #42d8ae !important;
  background: #ecfbf6 !important;
}
1
2
3
4
5
2
3
4
5
# 10.空气化学物化学式右下角的数字
常见化学式:SO₂,NO₂,O₃
// 向下取数据
<sub>2</sub>
// 向上去数据
<sup>2</sup>
1
2
3
4
2
3
4
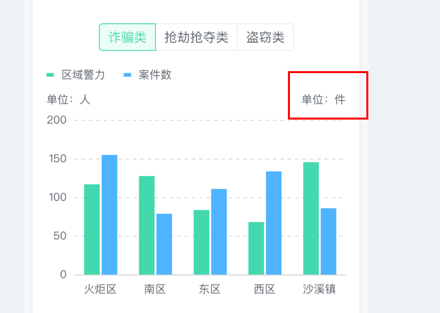
# 11.echarts的右侧单位
- 解决:使用yAxis的第二个name
问题:第二个的右侧单位被遮盖,无法显示
- 解决:unit: ['人', '件 '],unit[1]为单位后面加6个空格
yAxis: [
  {
    type: 'value',
    name: `${unit[0] ? '单位:' + unit[0] : ''}`
  },
  {
    type: 'value',
    name: `${unit[1] ? '单位:' + unit[1] : ''}`
  }
]
1
2
3
4
5
6
7
8
9
10
2
3
4
5
6
7
8
9
10
# 12.圆环,右侧lable让其只显示文本name,不显示百分比
d.legend = {
  ...d.legend,
  formatter: function (name) {
    return name
  }
}
1
2
3
4
5
6
2
3
4
5
6
# 13.修改圆环内部的百分比和文本name
// 修改圆环内部的百分比和文本name
d.series[0] = {
  ...d.series[0],
  data: arr,
  name: '',
  emphasis: {
    label: {
      show: true,
      fontSize: 20,
      fontWeight: 'bold',
      formatter: function ({ name, percent }) {
        return percent + '%' + '\n' + '{name2|' + name + '}'
      },
      textStyle: {
        rich: {
          name2: {
            fontSize: 12,
            fontWeight: 'normal',
            color: '#5C626B'
          }
        }
      }
    }
  }
}
1
2
3
4
5
6
7
8
9
10
11
12
13
14
15
16
17
18
19
20
21
22
23
24
25
2
3
4
5
6
7
8
9
10
11
12
13
14
15
16
17
18
19
20
21
22
23
24
25
# 14.修改label标题前面的内容,如多边形,---,图片,圆环等
legend: {
    formatter: function (name) {
        if (name === '受理数量 (件)') {
            return name
        } else {
            return '---  ' + name
        }
    }
}
1
2
3
4
5
6
7
8
9
2
3
4
5
6
7
8
9
# 15.label超出滚动
legend: {
    type: 'scroll'
}
1
2
3
2
3
# 16.根据类别更新颜色
// 根据类别更新颜色
// 封装
import { updateColor } from '@/myutils'
// 根据项修改颜色
export function updateColor (item, type) {
    var color = '#ddd'
    if (item[type] === 'I类') {
        color = '#00E400'
    } else if (item[type] === 'II类') {
        color = '#FFFF00'
    } else if (item[type] === 'III类') {
        color = '#FF7E00'
    } else if (item[type] === 'IV类') {
        color = '#FF0000'
    } else if (item[type] === 'V类') {
        color = '#99004C'
    } else {
        color = '#7E0023'
    }
    return color
}
const color = updateColor(item, 'dqsz')
1
2
3
4
5
6
7
8
9
10
11
12
13
14
15
16
17
18
19
20
21
22
23
2
3
4
5
6
7
8
9
10
11
12
13
14
15
16
17
18
19
20
21
22
23
# 17.封装通过res返回值,获取下拉框的属性labelProps,获取对应的对象,键值对数组
const objkeyArr = this.toKeyArr(res, 'zdlx')
// 通过res返回值,获取下拉框的属性labelProps,获取对应的对象,键值对数组
toKeyArr (res, labelProps) {
    const a = {}
    res.map((item) => {
        if (!a[item[labelProps]]) {
            a[item[labelProps]] = []
        }
        a[item[labelProps]].push(item)
    })
    return a
},
1
2
3
4
5
6
7
8
9
10
11
12
2
3
4
5
6
7
8
9
10
11
12
# 18.修改带面积折线图的线和阴影的颜色
d.color = '#42D8AE'
d.legend = {
  show: false
}
d.series.forEach(item => {
  item.areaStyle = {
    color: 'rgba(66, 216, 174, 0.2)'
  }
})
1
2
3
4
5
6
7
8
9
2
3
4
5
6
7
8
9
# 19.echarts的x轴倾斜45度显示
d.xAxis = {
  ...d.xAxis,
  axisLabel: {
    interval: 0,
    rotate: 45
  }
}
1
2
3
4
5
6
7
2
3
4
5
6
7
# 20.使用canvas实现水球图
<canvas ref="canvas" />
import Wave from './wave'
import Retina from './retina'
const canvas = this.$refs.canvas
canvas.height = canvas.clientWidth - 5
canvas.width = canvas.clientWidth - 5
this.canvas = canvas
this.canvasWidth = canvas.width
this.canvasHeight = canvas.height
this.radius = this.canvasWidth / 2
// 高清适配
Retina.run(canvas)
this.nowRange = 0
this.rangeValue = this.options.value > 100 ? 100 : this.options.value
this.wave1 = new Wave({
    canvasWidth: this.canvasWidth, // 轴长
    canvasHeight: this.canvasHeight, // 轴高
    waveWidth: 0.055, // 波浪宽度,数越小越宽
    waveHeight: 6, // 波浪高度,数越大越高
    colors: [this.config.strokeColor, this.config.strokeColor], // 波浪颜色
    xOffset: 0, // 初始偏移
    speed: 0.08 // 速度
})
this.wave2 = new Wave({
    canvasWidth: this.canvasWidth, // 轴长
    canvasHeight: this.canvasHeight, // 轴高
    waveWidth: 0.05, // 波浪宽度,数越小越宽
    waveHeight: 4, // 波浪高度,数越大越高
    colors: [this.config.wave2StrokeColor, this.config.wave2StrokeColor], // 波浪颜色
    xOffset: 2, // 初始偏移
    speed: 0.08 // 速度
})
this.draw()
draw () {
    const ctx = this.canvas.getContext('2d')
    ctx.clearRect(0, 0, this.canvasWidth, this.canvasHeight)
    if (!this.isDrawContainer) {
        this.drawContainer(ctx)
    }
    // this.drawBackground(ctx);
    if (this.nowRange <= this.rangeValue) {
        this.nowRange += 1
    }
    if (this.nowRange > this.rangeValue) {
        this.nowRange -= 1
    }
    this.wave2.update({
        nowRange: this.nowRange
    })
    this.wave2.draw(ctx)
    this.wave1.update({
        nowRange: this.nowRange
    })
    this.wave1.draw(ctx)
    window.requestAnimationFrame(this.draw)
}

drawContainer (ctx) {
    this.drawCircle(ctx)
}

drawCircle (ctx) {
    const r = this.canvasWidth / 2
    const lineWidth = 10
    const cR = r - lineWidth
    ctx.lineWidth = lineWidth
    ctx.beginPath()
    ctx.arc(r, r, cR, 0, 2 * Math.PI)
    ctx.strokeStyle = this.config.strokeColor
    ctx.stroke()
    ctx.clip()
    this.isDrawContainer = true
}
// wave.js
class Wave {
    constructor ({
                     canvasWidth, // 轴长
                     canvasHeight, // 轴高
                     waveWidth = 0.055, // 波浪宽度,数越小越宽
                     waveHeight = 6, // 波浪高度,数越大越高
                     xOffset = 0,
                     speed = 0.04,
                     colors = ['#DBB77A', '#BF8F3B'] // 波浪颜色
                 } = {}) {
        this.points = []
        this.startX = 0
        this.canvasWidth = canvasWidth
        this.canvasHeight = canvasHeight
        this.waveWidth = waveWidth
        this.waveHeight = waveHeight
        this.xOffset = xOffset
        this.speed = speed
        this.colors = colors
    }

    getChartColor (ctx) {
        const radius = this.canvasWidth / 2
        const grd = ctx.createLinearGradient(
            radius,
            radius,
            radius,
            this.canvasHeight
        )
        grd.addColorStop(0, this.colors[0])
        grd.addColorStop(1, this.colors[1])
        return grd
    }

    draw (ctx) {
        ctx.save()
        const points = this.points
        ctx.beginPath()
        for (let i = 0; i < points.length; i += 1) {
            const point = points[i]
            ctx.lineTo(point[0], point[1])
        }
        ctx.lineTo(this.canvasWidth, this.canvasHeight)
        ctx.lineTo(this.startX, this.canvasHeight)
        ctx.lineTo(points[0][0], points[0][1])
        ctx.fillStyle = this.getChartColor(ctx)
        ctx.fill()
        ctx.restore()
    }

    update ({ nowRange } = {}) {
        this.points = []
        const {
            startX,
            waveHeight,
            waveWidth,
            canvasWidth,
            canvasHeight,
            xOffset
        } = this
        for (let x = startX; x < startX + canvasWidth; x += 20 / canvasWidth) {
            const y = Math.sin((startX + x) * waveWidth + xOffset)
            const dY = canvasHeight * (1 - nowRange / 100)
            this.points.push([x, dY + y * waveHeight])
        }
        this.xOffset += this.speed
    }
}

export default Wave
// retina.js,高清适配
export default {
    run (canvasEl) {
        const canvas = canvasEl
        const ctx = canvas.getContext('2d')
        const devicePixelRatio = window.devicePixelRatio || 1
        const backingStorePixelRatio =
            ctx.webkitBackingStorePixelRatio ||
            ctx.mozBackingStorePixelRatio ||
            ctx.msBackingStorePixelRatio ||
            ctx.oBackingStorePixelRatio ||
            ctx.backingStorePixelRatio ||
            1

        const ratio = devicePixelRatio / backingStorePixelRatio
        if (devicePixelRatio !== backingStorePixelRatio) {
            const oldWidth = canvas.width
            const oldHeight = canvas.height

            canvas.width = oldWidth * ratio
            canvas.height = oldHeight * ratio

            canvas.style.width = `${oldWidth}px`
            canvas.style.height = `${oldHeight}px`
            ctx.scale(ratio, ratio)
        }
    }
}
1
2
3
4
5
6
7
8
9
10
11
12
13
14
15
16
17
18
19
20
21
22
23
24
25
26
27
28
29
30
31
32
33
34
35
36
37
38
39
40
41
42
43
44
45
46
47
48
49
50
51
52
53
54
55
56
57
58
59
60
61
62
63
64
65
66
67
68
69
70
71
72
73
74
75
76
77
78
79
80
81
82
83
84
85
86
87
88
89
90
91
92
93
94
95
96
97
98
99
100
101
102
103
104
105
106
107
108
109
110
111
112
113
114
115
116
117
118
119
120
121
122
123
124
125
126
127
128
129
130
131
132
133
134
135
136
137
138
139
140
141
142
143
144
145
146
147
148
149
150
151
152
153
154
155
156
157
158
159
160
161
162
163
164
165
166
167
168
169
170
171
172
173
# 21.搜索控制表格数据
<div class="mtb20 relative">
    <van-field
      v-model="inputValue"
      placeholder="搜索"
      right-icon="search"
      @blur="changeClick"
    />
  </div>
inputValue: '',
    changeClick () {
    this.transformData()
},
const tableHead = [
    {
        name: '所在镇街',
        width: 80,
        prop: 'zj',
        align: 'center'
    },
    {
        name: '单位类型',
        width: 110,
        prop: 'lx',
        align: 'center'
    },
    {
        name: '单位名称',
        prop: 'nameTit',
        width: 240,
        align: 'center'
    },
    {
        name: '操作',
        width: 60,
        align: 'center',
        fixed: 'right',
        formatter: (item) => {
            return '<span style="color:rgba(66, 216, 174, 1)">查看</span>'
        }
    }
]
matirialUsed = [
    {
        cws: "150"
        dwmc: "东凤镇第一人民医院"
        id: "11"
        lx: "医疗机构"
        nameTit: "东凤镇第一人民医院"
        tjsj: "2021年"
        tyshxydm: "9472hfu2489441"
        wdlx: "年"
        xxdz: "中山市东凤镇永益村东海五路"
        yfcsl: "152"
        yfzcl: "45"
        yfzyl: "36"
        zb: "113.27548,22.676825"
        zj: "东凤镇"
    }
]
1
2
3
4
5
6
7
8
9
10
11
12
13
14
15
16
17
18
19
20
21
22
23
24
25
26
27
28
29
30
31
32
33
34
35
36
37
38
39
40
41
42
43
44
45
46
47
48
49
50
51
52
53
54
55
56
57
58
59
2
3
4
5
6
7
8
9
10
11
12
13
14
15
16
17
18
19
20
21
22
23
24
25
26
27
28
29
30
31
32
33
34
35
36
37
38
39
40
41
42
43
44
45
46
47
48
49
50
51
52
53
54
55
56
57
58
59
# 22.修改legend滚动选中和未选中的样式
// 按钮选中颜色
pageIconColor: '#fff',
// 按钮未选中颜色
pageIconInactiveColor: '#2f4554',
pageTextStyle: {
  color: '#fff', // 翻页数字颜色
},
1
2
3
4
5
6
7
2
3
4
5
6
7